AWS Cost Optimizer
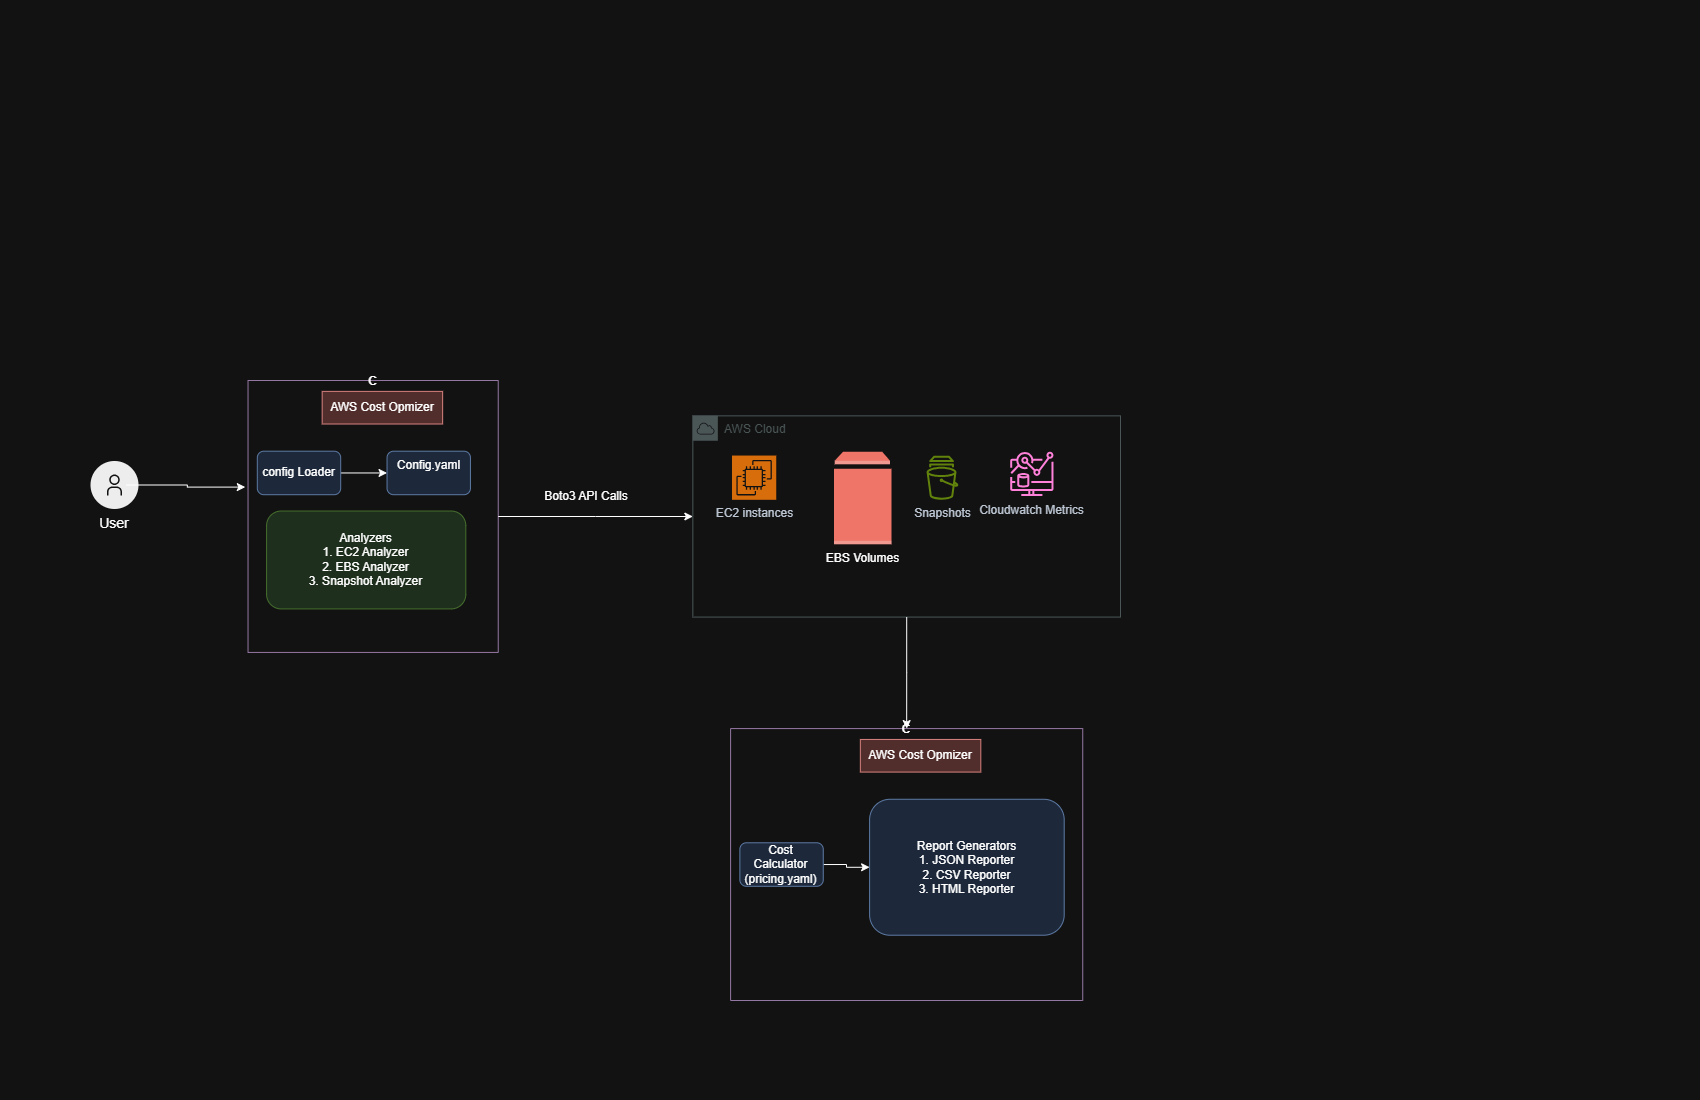
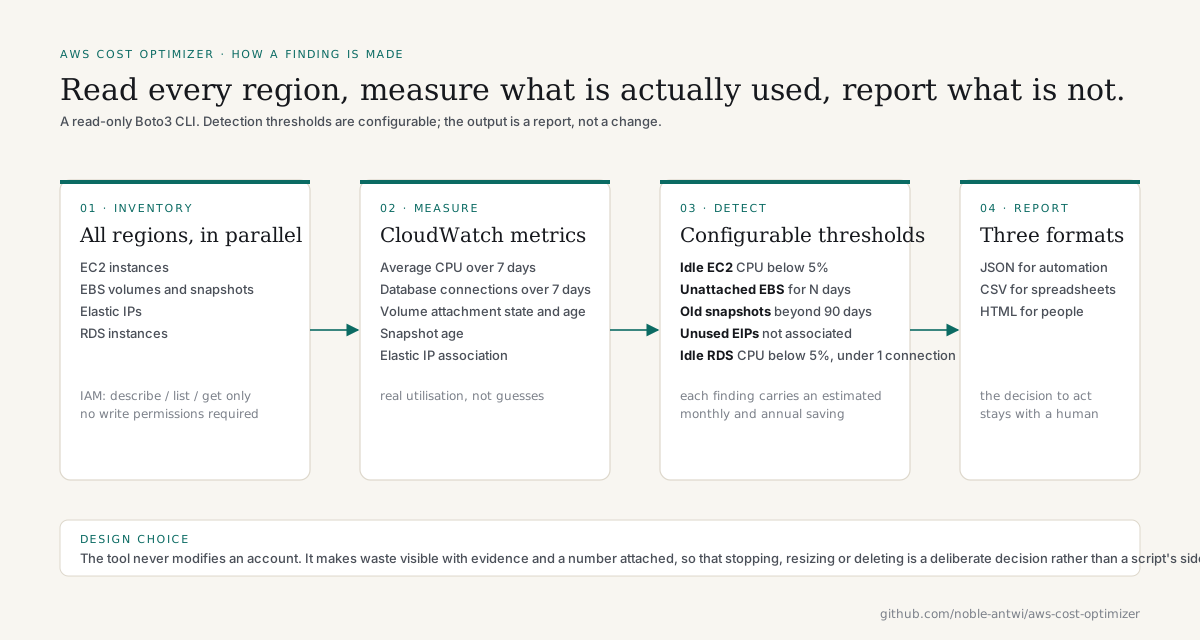
A read-only Python CLI that scans every region of an AWS account for idle EC2 instances, unattached EBS volumes, outdated snapshots, unused Elastic IPs and idle RDS databases, using real CloudWatch utilisation rather than guesses, and reports the waste with a monthly and annual figure attached.
The problem
Cloud waste is rarely dramatic. It is a stopped project’s volumes nobody detached, an Elastic IP that outlived its instance, a database that has had no connections since the demo, and snapshots from a retention policy nobody wrote down. Each is a few dollars a month. Together, across regions, they are the line item that makes the finance team ask what the platform team is doing.
I wanted a tool that finds those things with evidence, not heuristics, and that is safe to run against any account because it never changes anything.
What it does
Point it at an AWS profile and it scans every region (or the ones you list) in parallel, then writes a timestamped report set.
| Resource | Flagged when | Evidence collected |
|---|---|---|
| EC2 instances | Average CPU below 5% over 7 days, and older than 24 hours | CPU utilisation from CloudWatch |
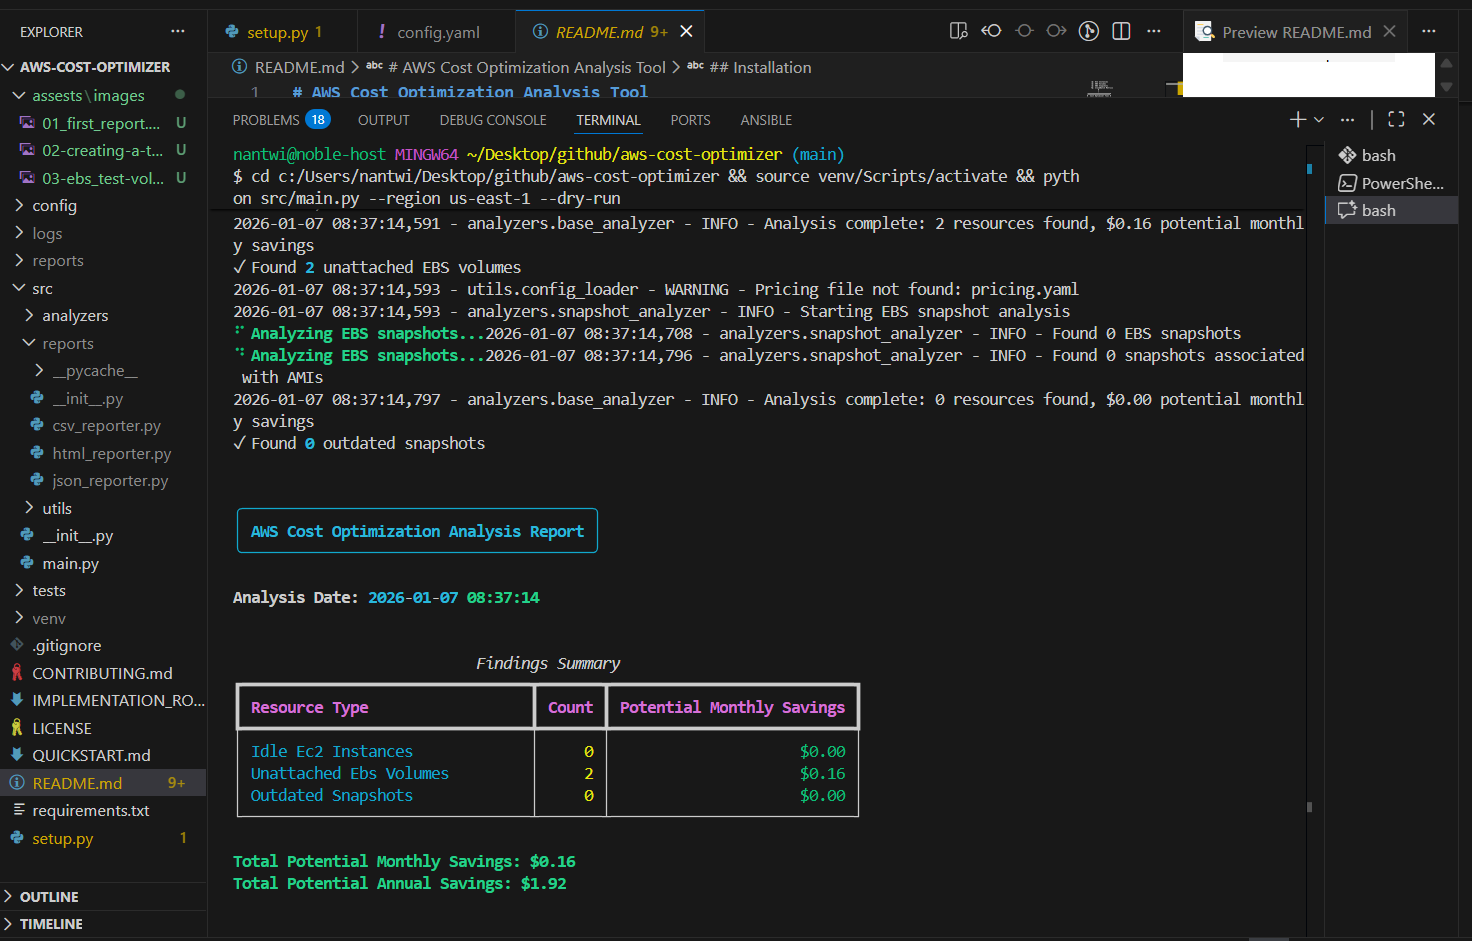
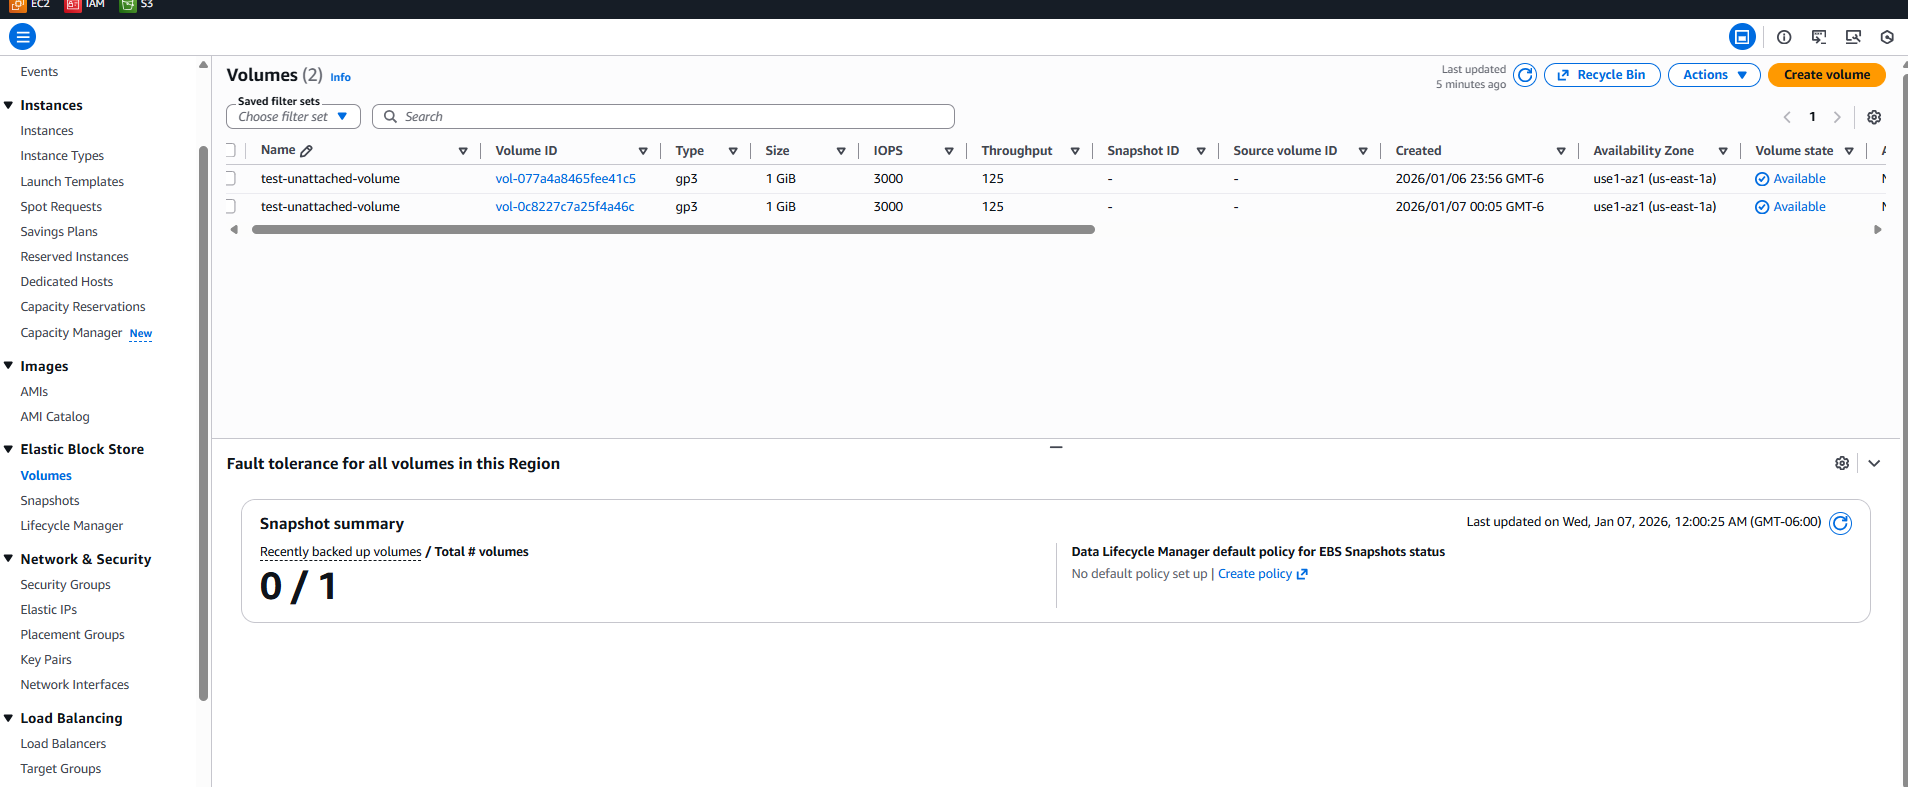
| EBS volumes | Unattached for longer than the configured days | Size, age, encryption state |
| Snapshots | Older than the retention period (default 90 days), unless an AMI depends on them | Age, size |
| Elastic IPs | Not associated with any resource | Address, region (about $3.60 a month each) |
| RDS instances | CPU below 5% and under one connection over 7 days | CPU and connection metrics |
Every threshold lives in config/config.yaml, so “idle” means what your organisation says it means.
Output
Three formats from one run, because three audiences read them:
- JSON for automation and CI pipelines, with every metric the analyzers used.
- CSV, one file per resource type plus an executive summary, for the people who live in spreadsheets.
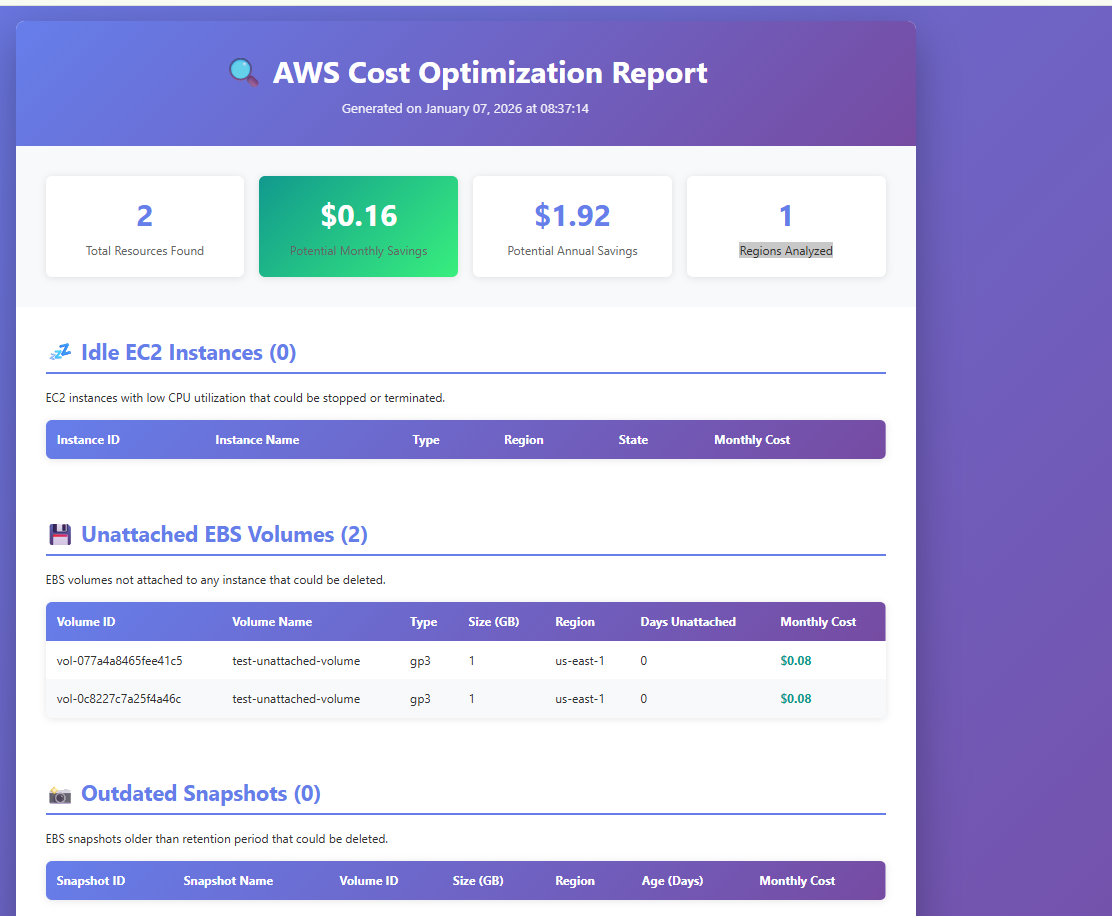
- HTML, an interactive report with cost calculations for the people who need to be shown.
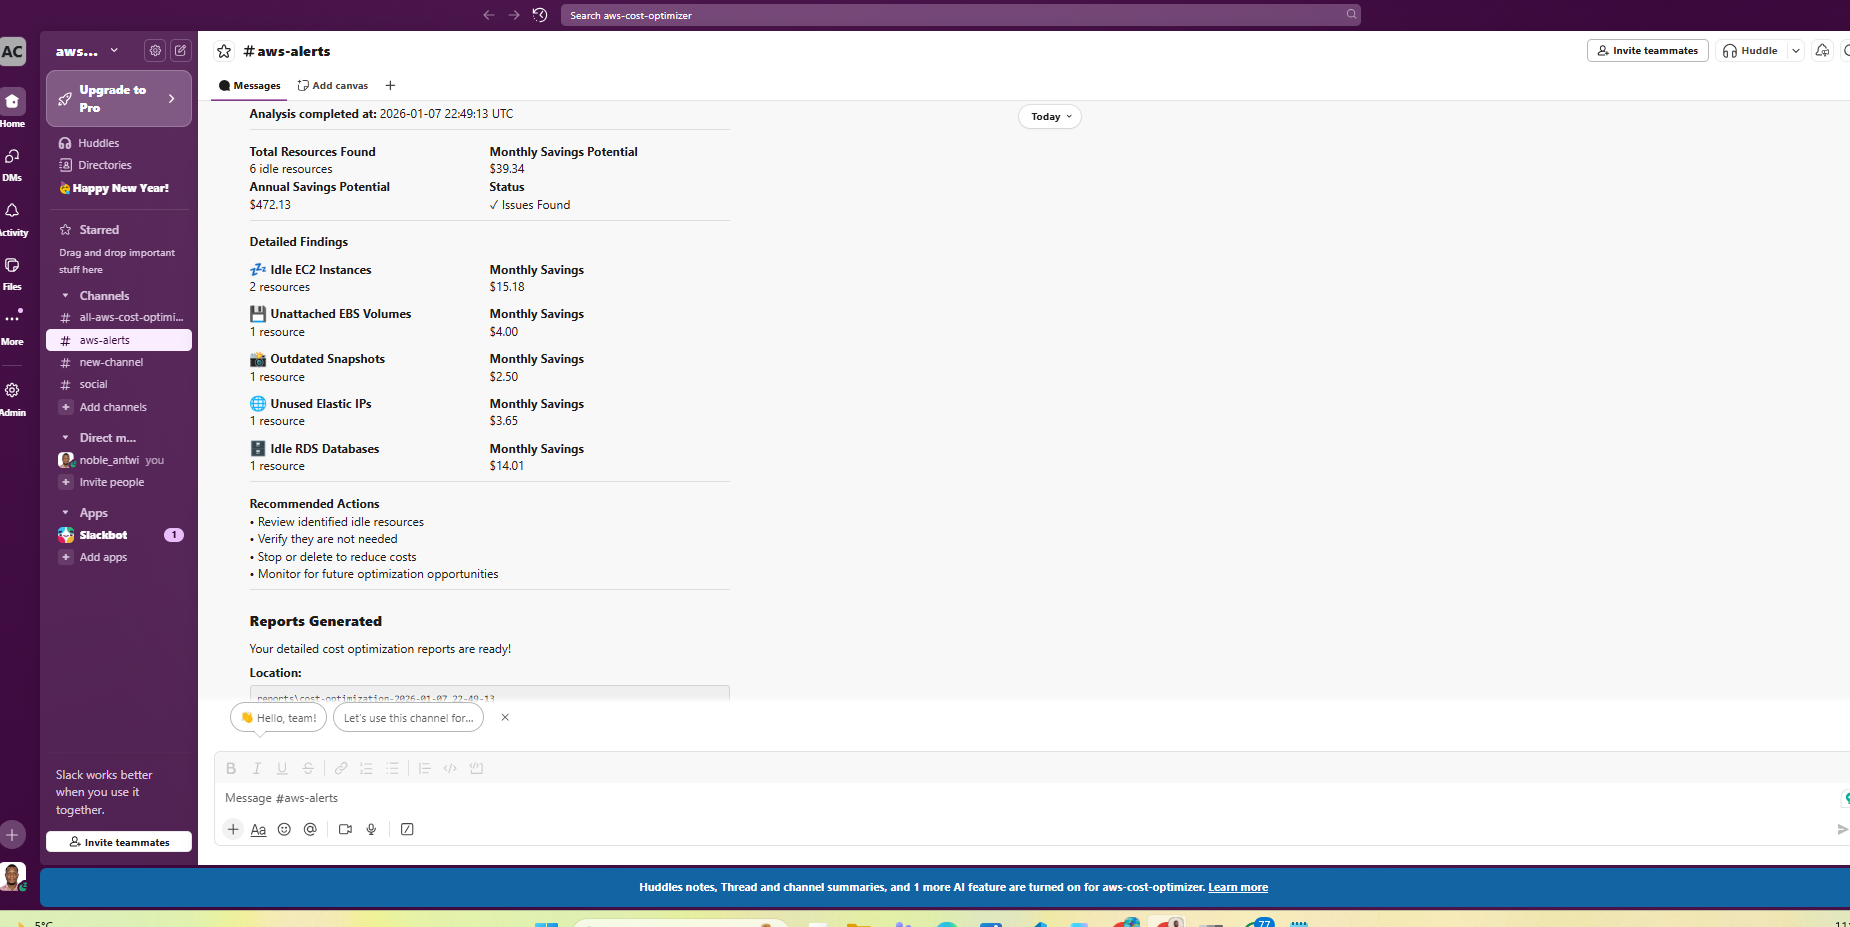
An optional Slack webhook posts the summary when a run finishes, with the total potential saving per month and per year.
Decisions worth explaining
Read-only by construction. The IAM policy the tool needs is Describe*, List* and Get* only. It cannot stop, resize or delete anything, which is what makes it safe to hand to someone who is not the account owner, and what keeps the decision to act with a human who can see the evidence.
Measured, not inferred. “Idle” comes from CloudWatch, not from instance size or tags. A small instance that is busy is not waste; a large one that has been at 2% CPU for a week is.
Evidence before estimate. Each finding carries the metric that triggered it and the saving it represents, so the report reads as an argument rather than a list.
What is next
- Right-sizing recommendations for the instances that are busy but oversized.
- Cost Explorer integration for spend trends alongside the point-in-time findings.
- A scheduled mode that diffs runs, so the report shows what changed since last week rather than the whole picture every time.
What it looks like when it is actually configured.
Screenshots from the build, named and captioned so each one can be traced to the configuration it proves.